


 25 / 180

181
ENHANCING PRIMARY CARE AND POST-ACUTE CARE
On a per capita basis, the elderly and the poor remained
the most frequent visitors to California ED’s in 2015 (Table
2). ED utilization continues to vary widely by health insur-
ance programs. This is seen most clearly in the high rates
of utilization by Medicaid members; a systemic deficiency
and a chronic concern of policy makers (15). Because
overall payment rates are low compared to other health
insurance programs, few primary or specialty physicians
in the community are willing to treat Medicaid benefi-
ciaries in private practices. Most private health insurance
programs seek to control ED utilization with increasing
share of costs. In patients without MCC, financial incentives
have been shown to increase likelihood to use community
clinics with lower cost structures than hospitals for their
lower-acuity problems (16).
Beneficiaries of Medicare, which covers Californians over
65 years old or with permanent disability, have more
chronic health conditions, resulting in higher rates of ED
utilization than younger ED patients. Since the elderly and
chronically ill have the highest risk of hospital admission
and readmission from the ED, the Medicare program is
placing more emphasis on the quality of post-acute care
and transitions of such patients back to the community
and their primary care providers (17).
Economics of Hospital Closures and Rising ED Visits
The number of hospitals offering emergency care has been
steadily decreasing for many years. Studies have shown
that lower-income areas are most often impacted by this
trend (18). Some of the capacity loss has been offset by
increasing numbers of beds and treatment areas in the
remaining ED’s. Between 2004 and 2013, OSHPD trend
data showed emergency department beds increased 34%
while emergency department visits grew by 40%. The
average treatment station was used by 1727 patients per
year, or 4.73 patients per day.
TABLE 2. CALIFORNIA EMERGENCY DEPARTMENT VISITS AND UTILIZATION PER THOUSAND BY INSURANCE - 2015
2015
POPULATION
UTILIZATION
PER 1000
ADMISSION
RATES
ALL ED VISITS ALL ED ADMISSION ALL ED ENCOUNTERS
MEDICARE
5644384
534
29.81%
2116800
898864
3015664
MEDI-CAL
11000000
532
9.27%
5313454
543149
5856603
PRIVATE
COVERAGE
18900000
201
9.49%
3432622
359812
3792434
UNINSURED
3800000
288
3.80%
1052663
41559
1094222
OTHER
N/A
N/A
8.52%
447627
41677
489304
UNKNOWN
4550
313
4863
12367716
1885374
14253090
Notes: Data on insurance coverage of the population in California came from the Kaiser Family Foundation. All data on ED visits and admissions were
from the Office of Statewide Health Planning and Development.
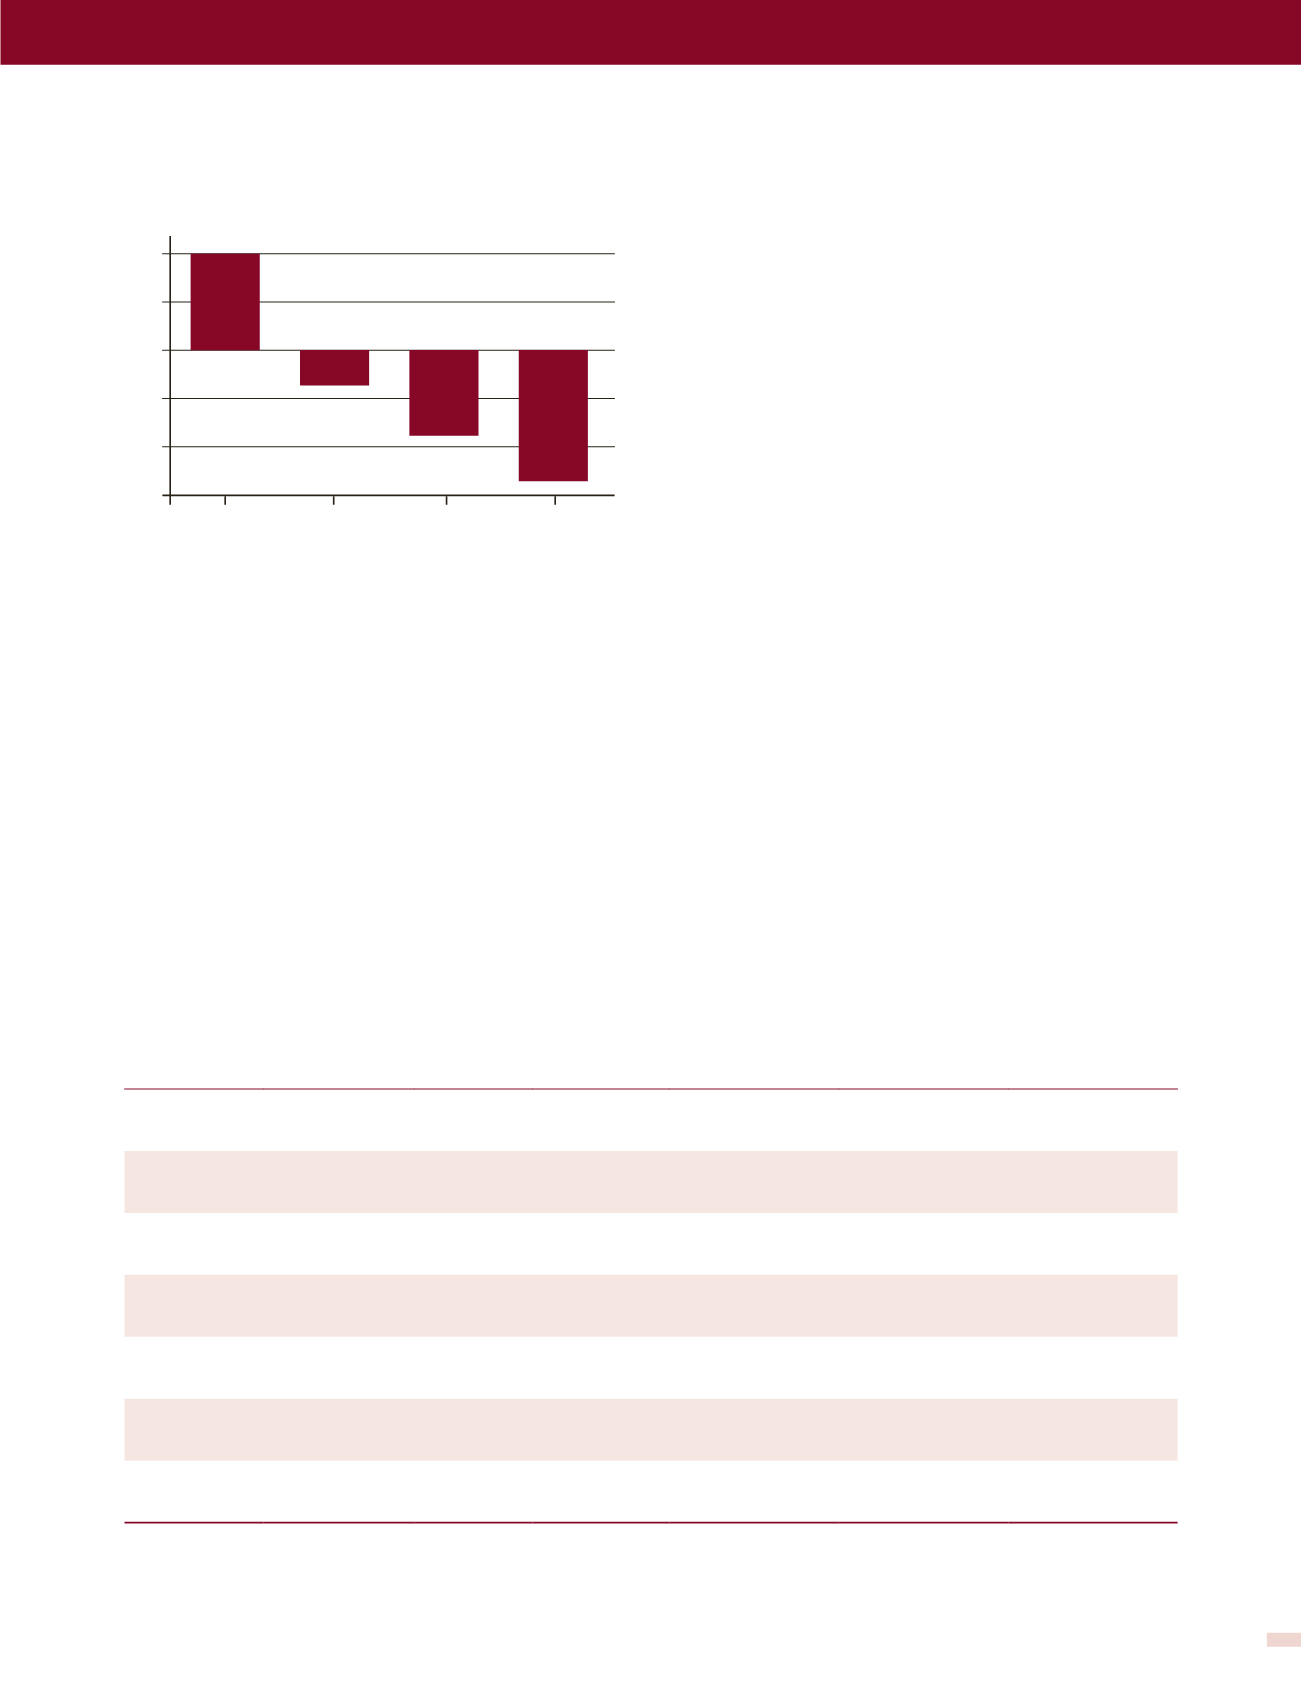
FIGURE 1. HOSPITAL PROFIT MARGINS FOR EMERGENCY
CARE BY INSURANCE TYPE - 2009
Note: From Wilson M, Cutler D. Emergency Department Profits Are Likely
to Continue as The Affordable Care Act Expands Coverage. Health Aff
(Millwood). 2014 May; 33(5): 792–799.
40
20
0
-20
-40
-60
Profit margen (%)
Private insurance Medicare
Medicaid
Uninsured
[THE ACUTE CARE CONTINUUM IN CALIFORNIA -William Wesley Fields MD FACEP.]